Good performance of a Linux system depends upon the availability of four key resources:
- CPU
- Memory
- Disk bandwidth
- Network bandwidth
Each is limiting. In other words, if the disks are working flat out then it doesn’t matter how much memory you have available: the system performance will suffer.
There are a variety of tools that can look at each one of those resources in detail, including top, htop, iotop and iftop. What’s missing from that list is an overall view, a tool that can tell you which area would benefit from more analysis.
atop
Enter atop, another tool which falls into the category of “best kept secrets”. atop has a curses interface that, by default, shows a summary of those four key resources (CPU, memory, disk I/O and network I/O), along with a list of processes sorted by CPU usage:
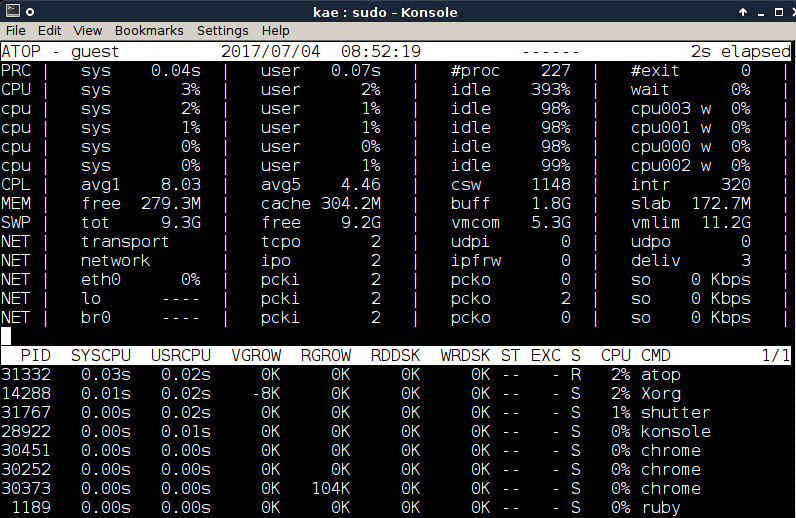
When first run, atop shows a summary of activity since system boot, and then it refreshes every ten seconds to show a summary since the last refresh. Ten seconds might be too long for the impatient system administrator, so
# atop 2
might be better, refreshing the display every 2 seconds.
Drill Down
That’s a nice summary, but so far the functionality isn’t very far removed from the more familiar top command. However, when a system resource is in heavy demand, atop will highlight it in red:
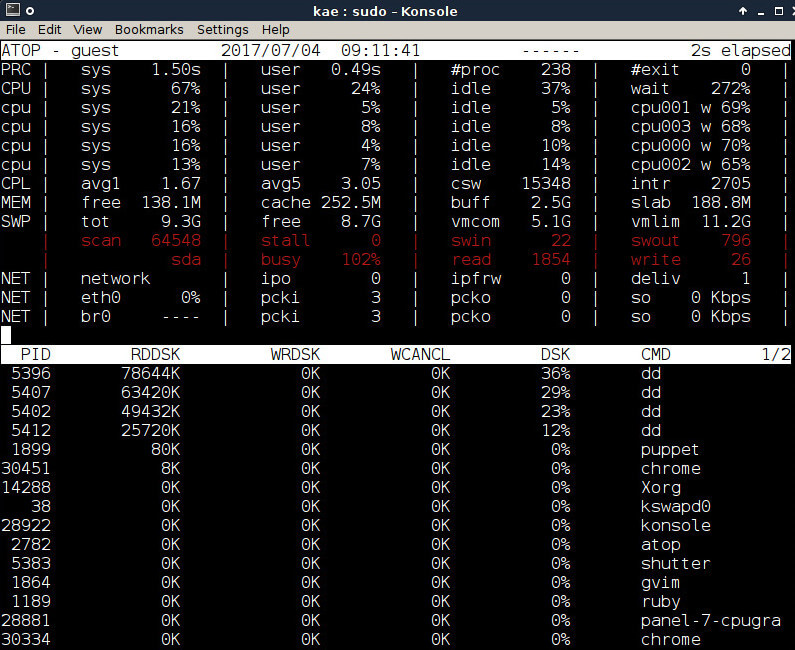
If this system isn’t performing well right now, it would be worth investigating which processes are using the most disk I/O. While atop is running, we can press d to sort the process list by disk I/O:
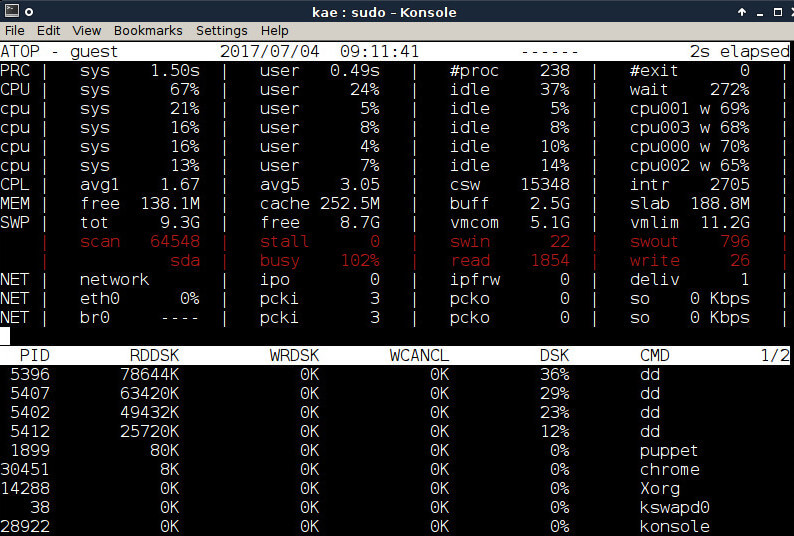
Here, we can see that four copies of dd are running simultaneously. There is a lot of data being read from the disks (RDDSK), none written, and the four processes between them are keeping the disk 100% busy.
Similarly, process can be sorted by memory usage (m key), processor (CPU) usage (p key) or network usage (n key). Network usage requires the installation of a kernel module, netatop.
More Information
atop is smart in that when it is run from a screen, it checks the size of the screen or terminal window and adjusts the number of columns displayed accordingly. Running atop in a full screen window may be helpful.
Historical Data
atop can clearly be helpful when a system appears to have performance issues, but what if the performance issues were in the past? A system that ran slowly overnight, but which is now performing well still needs diagnosis.
The default installation of atop will also start an atop daemon that writes snapshot information to a log file. By default, the snapshot is every 10 minutes; the log file is /var/log/atop/atop_YYYYMMDD; the logfiles are retained for a month. All defaults are configurable.
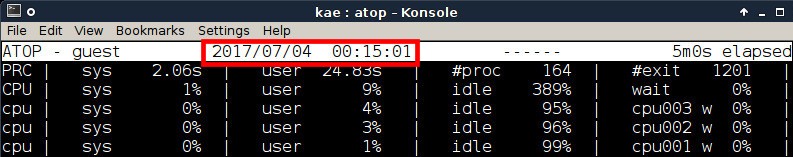
So how do we examine what the system was doing at 3am? Running atop with the -r option will read system information from a log file rather than the live system:
# atop -r /var/log/atop/atop_20170704
A useful shortcut: if the log file name is replaced with y, yesterday’s log will be read – and yy reads the day before yesterday, and so on:
# atop -r yy
The display is the same, except of course it is static rather than being updated every few seconds. The top of the window shows the time of the snapshot:
Pressing t will step the display through the log file one interval at a time; pressing T will step it back through the file. That can be a little tedious if you want to look at what happened at 10pm, so the b key will prompt you for the time (HH:MM) to jump (“branch”) to in the log file. r will rewind to the beginning of the file.
This is only a brief introduction to atop, and as ever the man page (atop(1)) has more information. It is a tool worth investigating, and its ability to look at historical performance data in an easy-to-use interface can be very helpful.
Could This Tech Tip Be Improved?
Let us know in the comments below.