In Linux System Monitoring, Part 1, we looked at different types of monitoring. We continue in this article with an examination of Trend Monitoring and Log Monitoring.
Trend Monitoring
Whereas status monitoring is helpful in identifying problems when they begin to make themselves apparent, system trend monitoring is concerned with looking at various system parameters over a longer period of time. Typically, many of the same parameters are measured, but are presented as graphs, This can be helpful in a number of ways:
- highlighting when changes occur
- identifying transient issues
- capacity planning
- system tuning
Taking our disk example again, if we also graph disk space usage over time we can see whether this is linear growth, in which case we can reasonably predict how long we have until the disk would be full, or whether there was a sudden change in the rate at which the partition is filling up, in which case it may be worth investigating what happened to cause the rate to change.
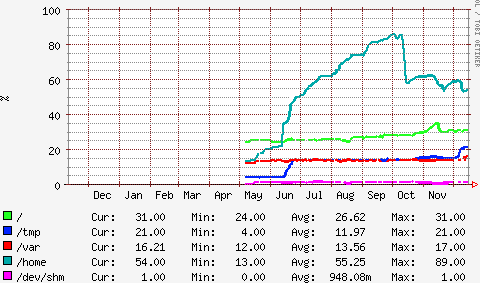
Disk Example
The graph below shows the disk usage of a system over time. It can be seen that the “/home” partition (the top line) was filling up between June and early October. The system status monitor alerted support staff to the fact that the disk was getting full, and the graph below enabled a judgement to be made that, unless something was done, the system would run out of space in about two months’ time. In this particular case, some files that were no longer required were deleted, shown by the drop in mid-October, but it would have been possible to schedule the fitting of an additional or larger disk if that had been appropriate.
Transient Issues
Transient issues are issues which resolve themselves before a cause can be identified; for example, “The web server was very slow yesterday around 2pm”. This statement is riddled with problems from a system administration perspective:
- what does “very slow” mean?
- was it slow for everyone or just one user?
- was it actually 2pm?
- …and so on
Sometimes log files will show an obvious or possible cause, but failing that it can be hard to know where to start. Is this a database problem, a lack of memory, a network issue, more users than usual, or something else entirely? A look at the trend graphs for the time period in question can often give an indication. They will show:
- the number of database queries per second
- memory usage
- how much swapping was taking place
- the number of Apache threads
- network bytes send and received per second
- total number of processes running
- CPU usage
All we’re looking for is a spike of some kind around 2pm yesterday. We might find, for example, that the number of MySQL “slow queries” peaked at 13:58. Why were there so many slow queries? It turns out that someone ran the end-of-month report during the day. Now we know why the web site was slow, and to prevent the same problem happening next time we could:
- improve the database indexing that the end-of-month report requires
- don’t run that report during working hours
- have a monitor that measures web site response times
Log Monitoring
The System Logger is an integral part of Linux and, as its name implies, it keeps a record of things that happen on your server. The logging system is very flexible, and may be configured to log pretty much anything. Some typical examples:
- a user logs in
- an email is received
- the internal clock is adjusted by 27 milliseconds
- an application creates a new customer record
For the most part, the examples given above are of little interest. However, when a user reports that they’ve not received an expected email, the logs allow the system administrator to check whether that mail has been received by the system and whether there were any problems with it (perhaps it was rejected because the recipient’s address was mistyped).
Occasionally, there will be events logged that should be acted upon. Maybe a disk is reporting errors, or perhaps there are repeated attempts to log into a non-existent user account. The challenge is in finding the messages that are significant to your environment amongst the thousands of benign messages logged every day. Searching the logs manually is both time-consuming and inefficient.
One approach is to define what is being sought, and have a report sent each time a match is found. The challenge, though, is defining what to look for. Searching for “error” in the logs might highlight some interesting entries, but it won’t find a line reporting “Unknown user: fredbloggs”.
A better approach is to do the opposite: define what we don’t want know about, and then report on everything else. All of the same information is logged and available if required, but the report that is generated contains only what is left after the benign messages have been filtered out.
The aim here is to only ever receive reports that will be acted upon: if something is reported that does not require action, that “something” should be added to the filters so it is no longer reported. Initially there’s likely to be a lot of benign data reported, but over time such data can be filtered out, and the reports become significantly more valuable.
The end result should be a small number of short reports detailing the log entries that didn’t match the “expected” ones, and which require action. It is taking that action that increases the security or availability or performance of your server.
Coming Up
In the next article in this series, we’ll look at what should and what could be monitored.
Was This Article Helpful?
Let us know in the comments below.


